English
  中文
中文


The stated goal is to reduce market distortion and force renewable developers to compete on merit. The likely result, however, is higher electricity prices, a strained grid, and a new wave of supply-chain pressure across the U.S. solar tracker controller market — at exactly the moment U.S. electricity demand is climbing faster than at any point in decades.
This article is for: utility-scale solar developers, EPC contractors, asset managers, and procurement teams evaluating whether 2026–2027 project pipelines remain viable under the new subsidy regime — and how every component decision, including the choice of a solar tracker controller, now carries a much higher weight on project returns.
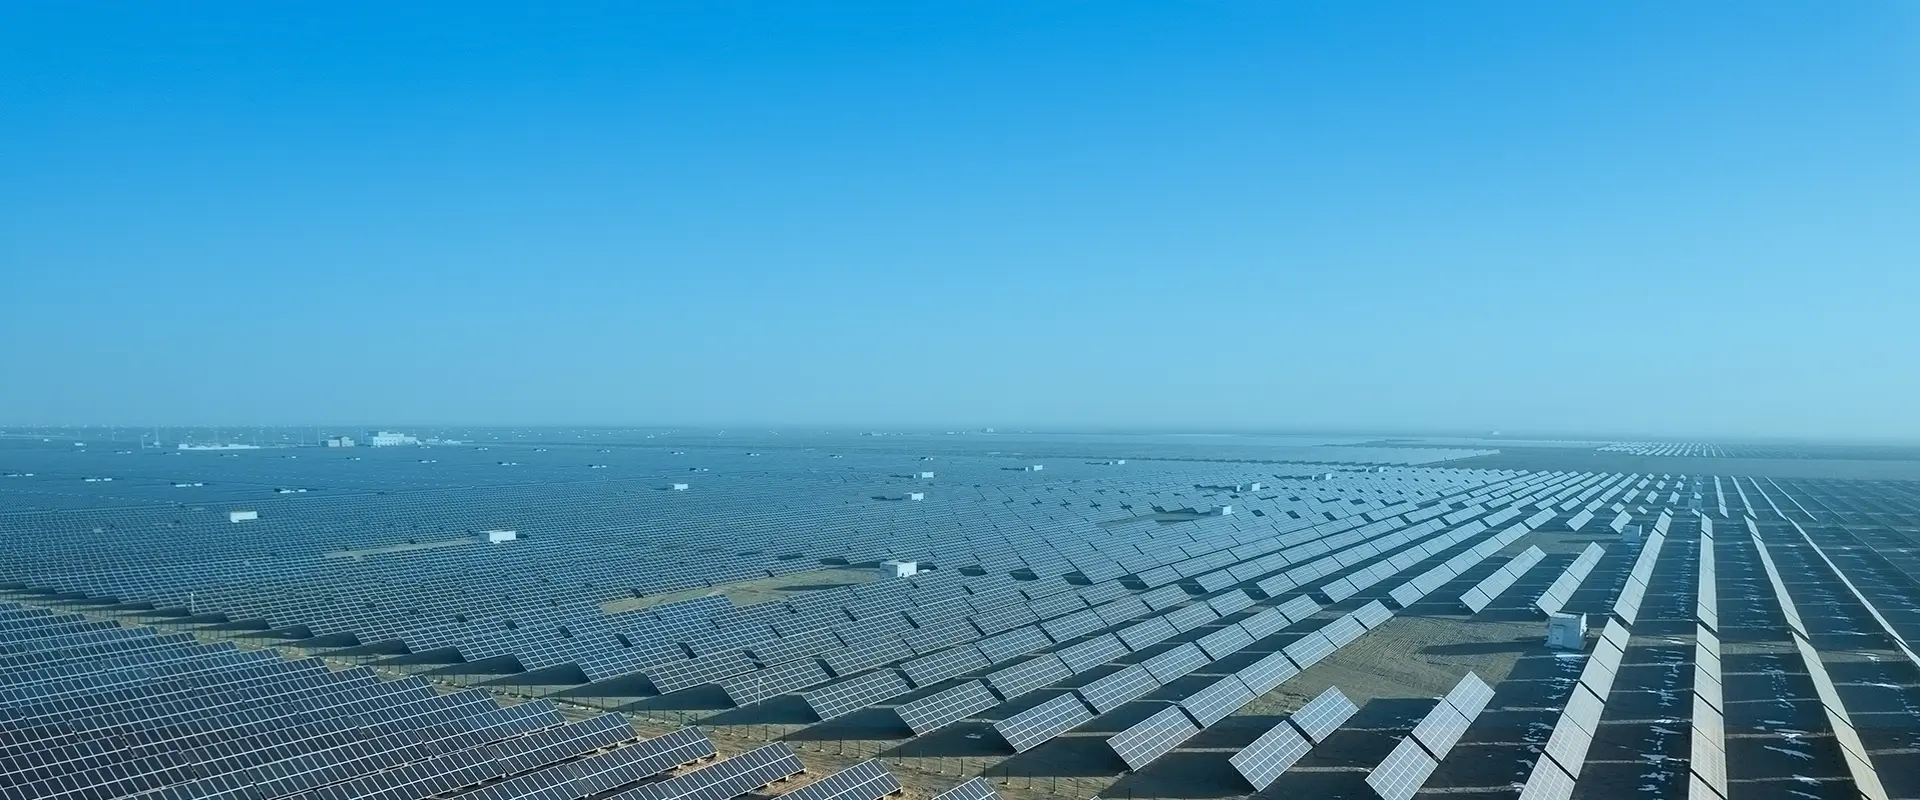
Since 2020, solar has been the largest source of new generating capacity added to the U.S. grid, and wind remains one of the largest contributors of new utility-scale capacity. Industry analysts had previously expected solar to remain the dominant source of new builds through the next decade — even under less favorable policy. The sudden subsidy cut, however, is fundamentally reshaping those expectations.
After decades of flat-to-modest growth, U.S. electricity demand is now rising rapidly, driven by data centers, AI infrastructure, reshored manufacturing, and broad electrification across buildings and transport. The U.S. Energy Information Administration (EIA) projects U.S. electricity demand to grow by 25% to 50% by 2050.
Against that backdrop, withdrawing federal support for wind and solar looks paradoxical. Critics argue that if wind and solar were truly competitive, they should not need subsidies — but every mainstream generation technology has received government support at some stage, through tax incentives, R&D funding, credit guarantees, or regulatory carve-outs. The U.S. oil and gas industry has received federal subsidies and tax preferences for over a century; coal, even longer. The question is not whether subsidies are philosophically right, but whether removing them right now will improve market outcomes.
U.S. households will feel this directly. A study commissioned by the Clean Energy Buyers Association and conducted by NERA Economic Consulting projects that repealing clean-energy tax credits will:
- Raise the average U.S. residential electricity price by nearly 7% in 2026 — equivalent to $110+ in extra annual bills for a typical household.
- Raise commercial electricity bills by roughly 10%.
- Add $180/year to the average Illinois household utility bill starting in 2026.
- Cut 167 GW of grid capacity from the U.S. pipeline — right as data center and advanced-manufacturing demand is climbing.
- Add $121.2 billion in combined electricity and natural-gas costs to the U.S. economy between 2027 and 2033.
- Push 2026 commercial and residential electricity prices up by as much as 29.5% in the hardest-hit states.
U.S. solar installed capacity nearly doubled from 2022 to 2025, rising from 141 GW to 279 GW. That growth is now expected to slow sharply.
— Paul Cicio, Industrial Energy Consumers of America
— Jason Caponi, CEO of Captona
- Transformers: Prices have risen 60–80% since 2020, per the American Society of Civil Engineers.
- Solar labor costs: Up 15% in 2025 alone.
- Grid interconnection, permitting, and financing all face tightening constraints.
— Partner at Cooley LLP
Three categories of decision are now under sharper scrutiny:
- Independent per-row tracking recovers 3–5% annual energy yield on terrain with slope variation, backtracking conflicts, or partial shading — exactly the kinds of sites that dominate the U.S. utility pipeline.
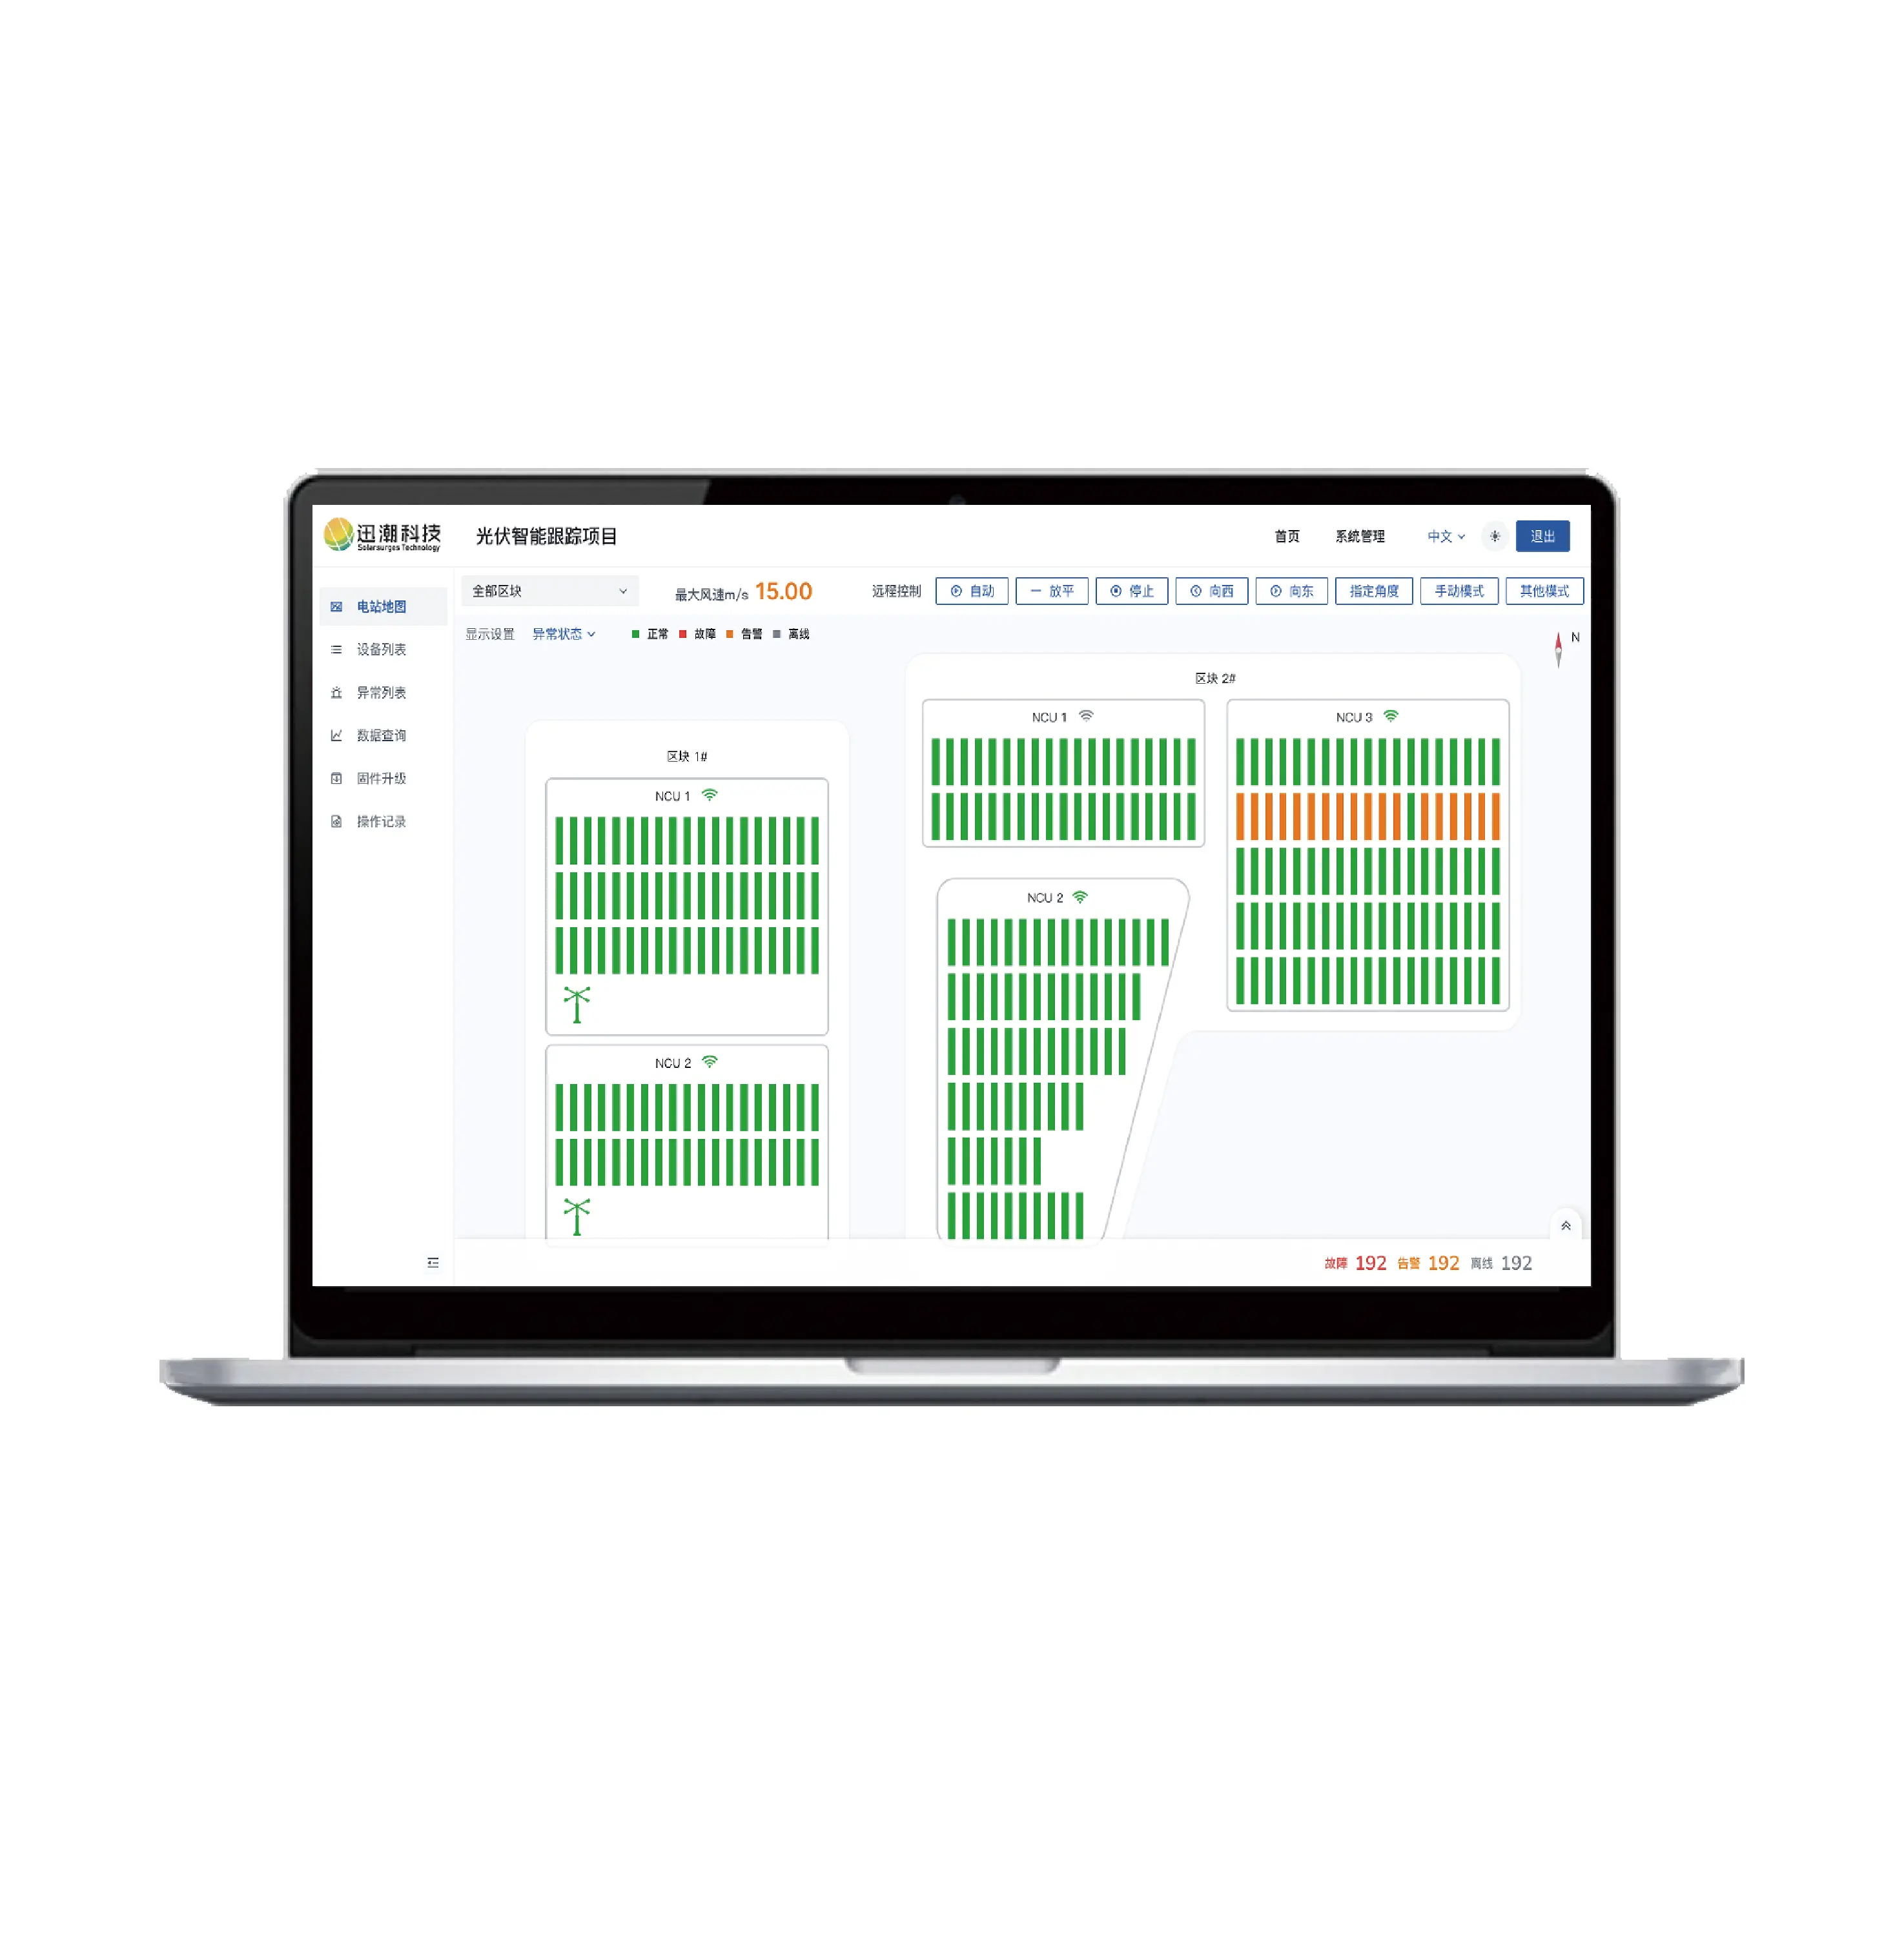
- Distributed TCU control limits fault propagation: a single motor or wiring failure takes one row out, not a megawatt block.
- NCU-level edge computing enables sub-second storm-mode response (typically <0.5s from gust detection to stow), protecting modules and drives during the high-wind events that increasingly accompany utility-scale siting.
In short, the OBBBA subsidy cut doesn't just shrink the developer margin pool — it raises the value of every basis point of yield that a well-designed tracker control system can extract. The right solar tracker controller decision in 2026 will be visible in 2027 PPA revenue, in 2030 repowering economics, and in 2035 asset sale multiples.
When demand grows faster than supply, prices rise. The fastest way to bring prices down is to add generation capacity, not to remove incentives for new capacity. Industry consensus is clear: the U.S. needs accelerated investment in generation, transmission, distribution, and storage — not new obstacles for the two technologies that have built the most new capacity over the past five years.
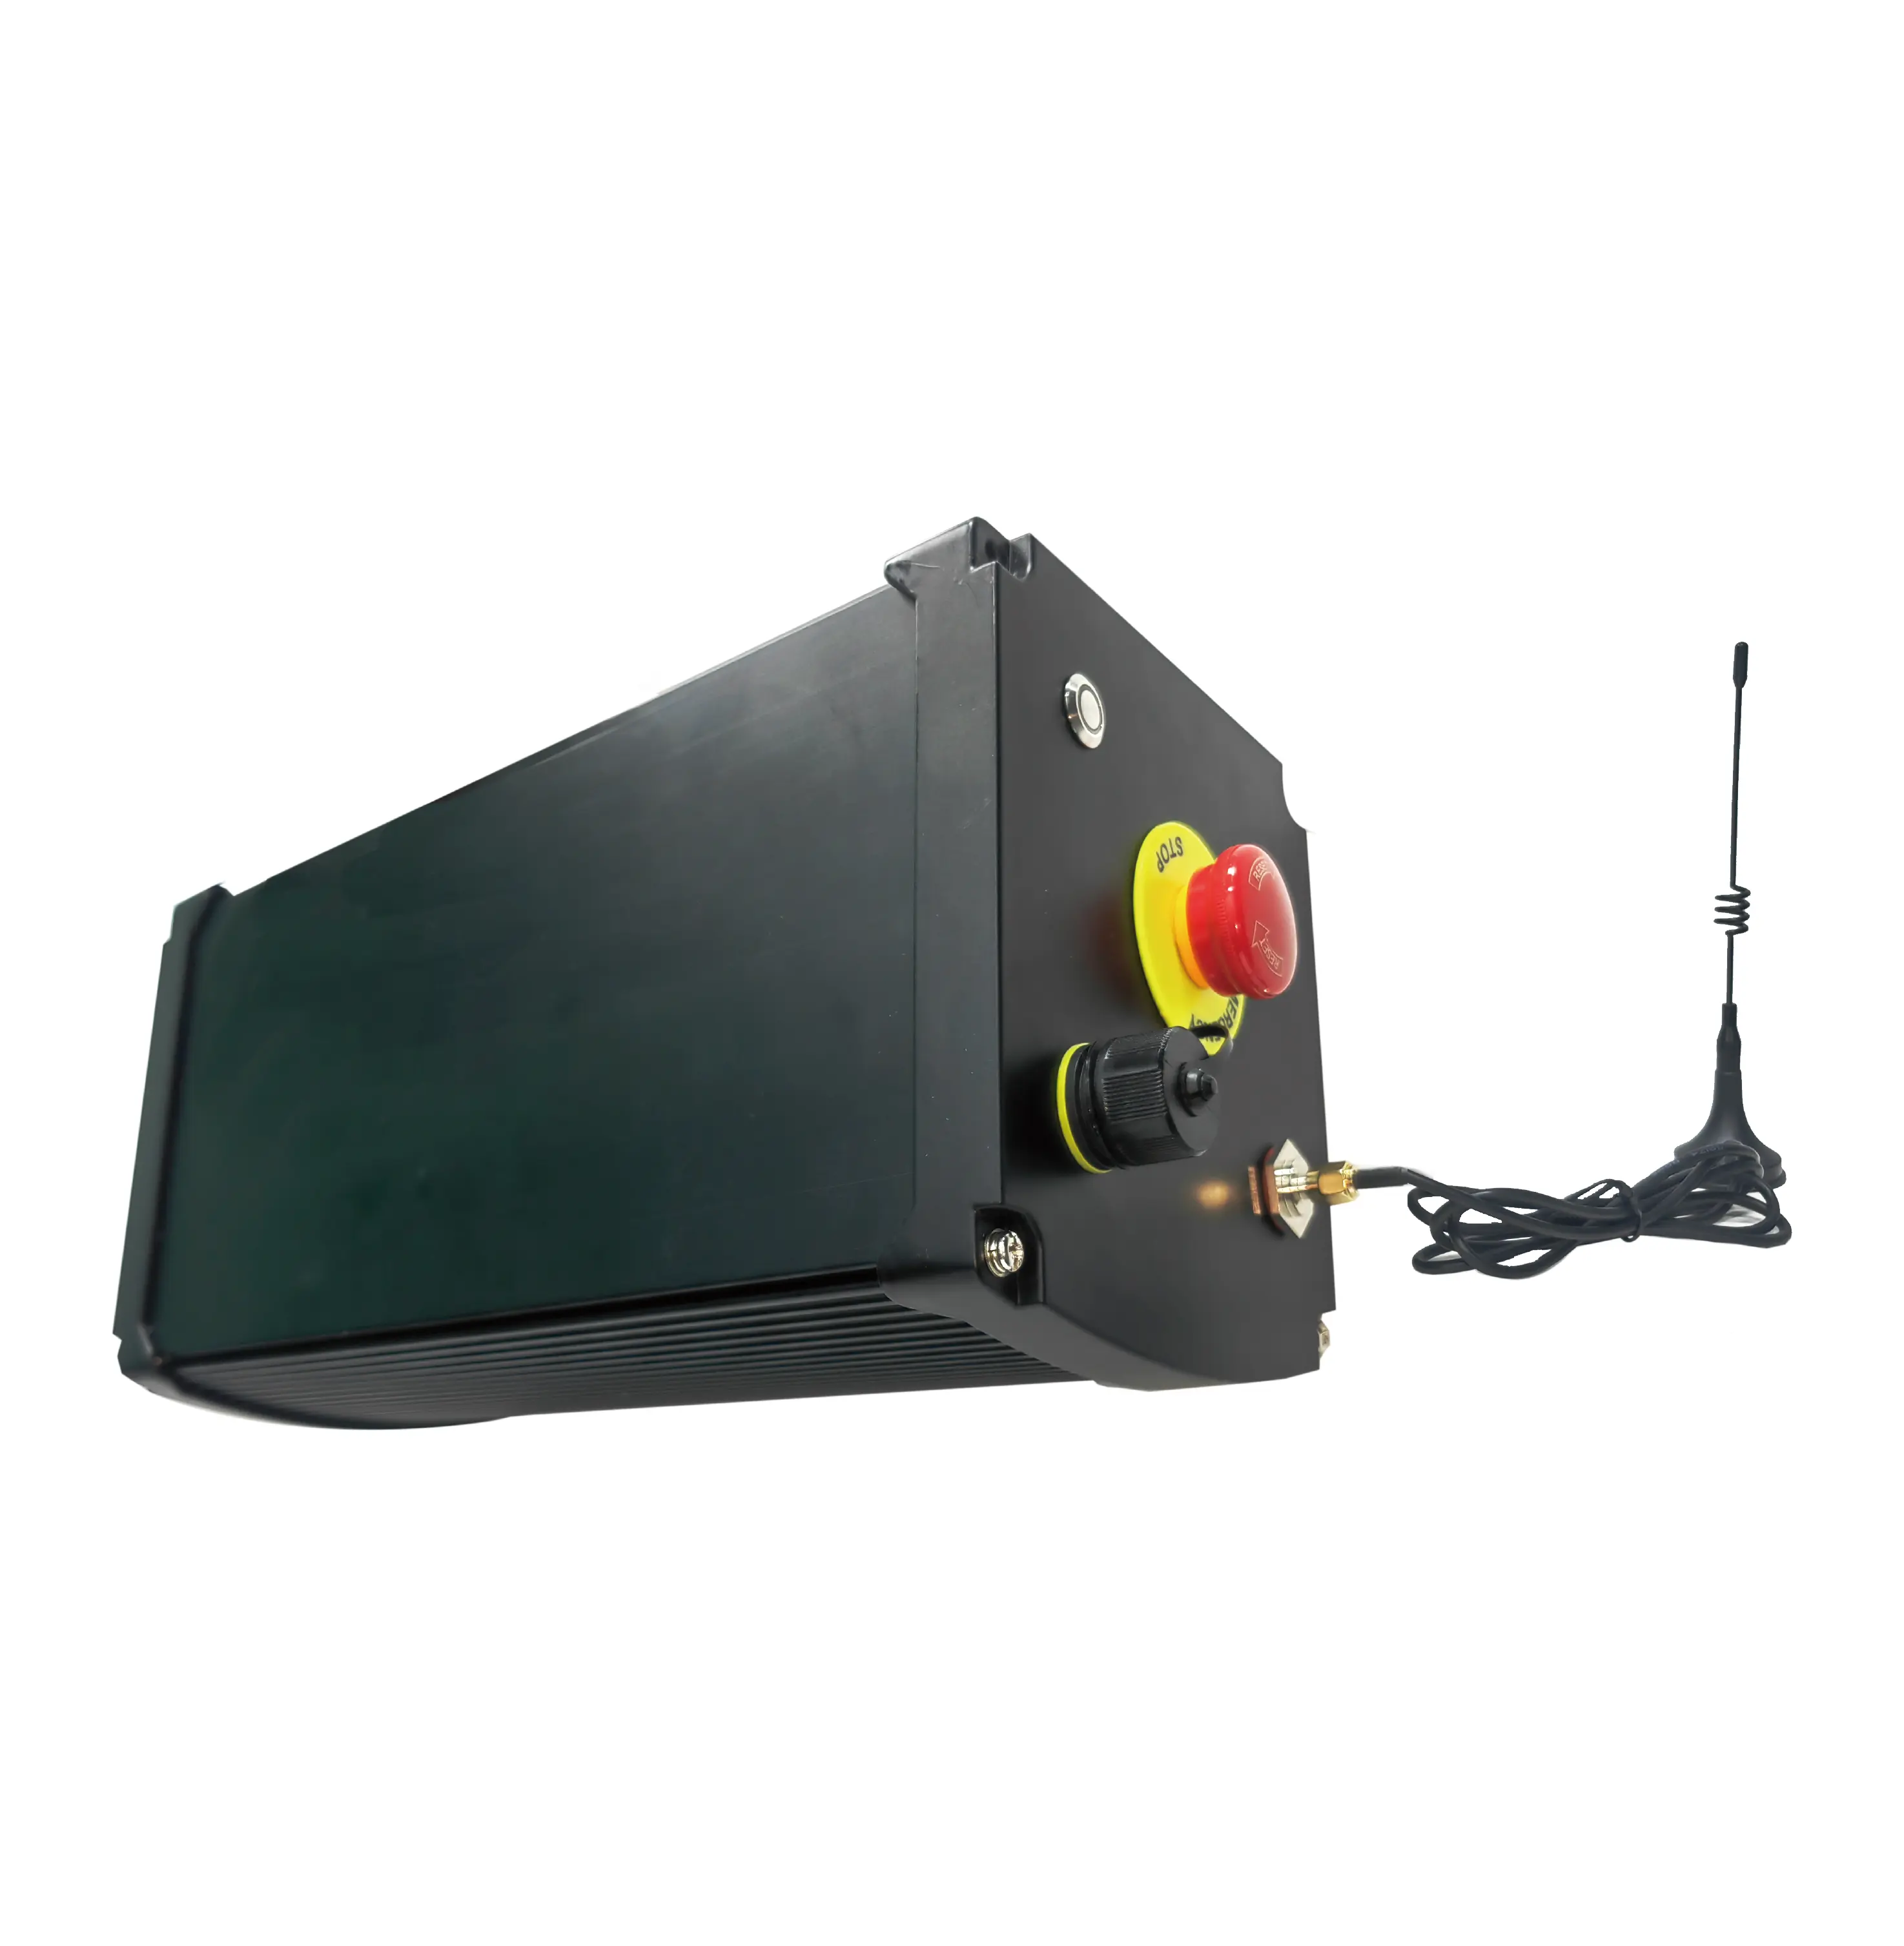
For developers and EPCs, the practical response is not to retreat from solar but to raise the engineering bar. That means selecting a solar tracker controller architecture — the right combination of distributed solar tcu row intelligence, a capable solar ncu plant controller, and a PV tracker controller software stack that can be updated over the asset's full life — that protects yield, controls BOS cost, and remains flexible as interconnection, AI demand, and grid economics continue to evolve.
Data current as of July 7, 2026. Sources: LevelTen Energy, NERA Economic Consulting, U.S. Energy Information Administration, American Society of Civil Engineers, Reuters, and public reporting. This article is informational and does not constitute investment advice.
Related Solar Tracker Products